
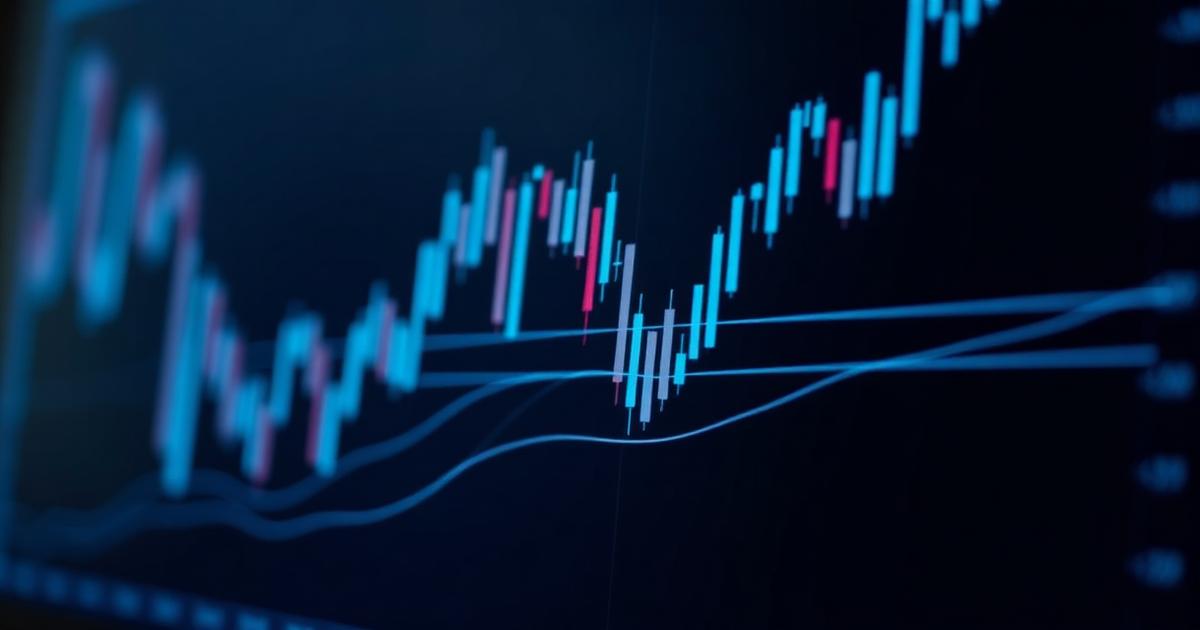
Why the same hammer works at a tested support and fails in the middle of a range — and how to add the missing context.
Key takeaways
- A pattern's value depends entirely on where it forms.
- Combine patterns with level, trend and volume before acting.
- Backtest patterns on your own instrument before trusting a textbook statistic.
Candlestick patterns describe the balance between buyers and sellers within a period. A hammer at the low of a multi-week base after a volume spike is meaningful. The same hammer at the midpoint of a quiet range is noise with a name.
Add three filters before treating a pattern as tradeable: is it at a rule-defined level, is it aligned with the higher-timeframe trend, and did participation expand? Patterns that pass all three are far rarer and far better.
Beware imported statistics. Hit-rate tables from foreign markets and different eras rarely transfer to Nifty or MCX crude. If a pattern matters to your plan, measure it on your instrument and your timeframe.
Used properly, candles are a way of reading the current session's argument. They are not a prediction engine, and treating them as one is why so many chart-literate traders still lose money.
Related guides
Technical
Trading with VWAP: an institutional reference point
Volume-weighted average price is where large orders are benchmarked. How to use it as context, support and a mean.
Technical
Support and resistance: making a vague idea measurable
Levels are useful only when defined by rules. How to build a repeatable level map for Indian indices and stocks.
Technical
Volume and liquidity: reading participation instead of price alone
Why the same candle means different things at different volumes, and how liquidity should shape which instruments you trade.
Technical
Moving averages: what they can and cannot tell you
Trend filters, dynamic levels and crossover myths — a practical guide to using averages without over-fitting.
Your edge deserves
real capital
Start today from ₹1,499, trade Equity, F&O, Currency or MCX your way, and get paid in rupees on exactly the terms you were shown on day one.
Trade · Prove · Get Funded — evaluation fee refunded with your first INR payout.